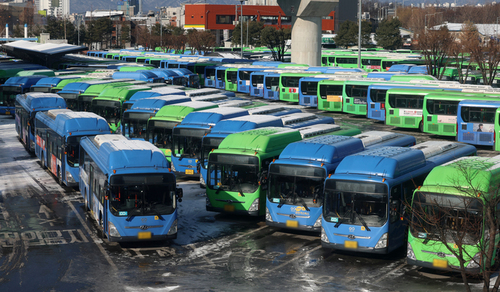
▲ 2025년 이민자체류실태 및 고용조사 체류자격별 외국인의 한국생활 © 박상도 기자 |
(브레이크뉴스인천 박상도 기자) 정부가 10일, '2025년 이민자체류실태 및 고용조사 체류자격별 외국인의 한국생활'을 발표했다.
자료에서 체류자격별 상주 외국인 현황(15세 이상)을 보면, 2025년 5월 기준, 15세 이상 상주 외국인(이하 ‘외국인’)은 169만 2천 명이다.
전년 대비 유학생(3만 6천 명), 영주(2만 1천 명) 등에서 증가하였고, 방문취업(-1만 명)은 감소했다.
체류자격별 비중은 재외동포(24.2%), 비전문취업(19.0%), 유학생(14.0%), 영주(9.6%) 순이다.
전년 대비 유학생(1.2%p), 전문인력(0.7%p) 등에서 증가했다.
성별로 보면, 외국인의 성별 비중은 남자(57.9%)가 여자(42.1%)보다 15.8%p 높았다.
남자는 비전문취업(90.4%), 전문인력(76.4%), 방문취업(57.0%) 등이 높고, 여자는 결혼이민(79.5%), 유학생(52.1%) 등이 높았다.
전년 대비 남자는 전문인력(4.6%p), 영주(2.0%p) 등에서 상승하였고, 여자는 재외동포(1.0%p) 등에서 상승했다.
연령대별로 보면, 외국인의 연령대별 비중은 15~29세(30.9%), 30대(27.5%), 40대(15.7%) 순이다.
비전문취업은 30대 이하 비중이 93.0%(15~29세 46.9%, 30대 46.1%)이며, 방문취업은 50대(43.0%), 전문인력은 30대(53.5%)의 비중이 가장 높았다.
전년 대비 방문취업은 30대에서 5.8%p 상승하였고, 50대에서 7.4%p 하락했다.
유학생의 90.5%는 15~29세이며, 재외동포는 39.6%가 60세 이상이다.
교육수준별로 보면, 외국인의 교육수준별 비중은 고졸(43.1%), 대졸이상(30.8%) 순이다.
전문인력과 기타를 제외한 체류자격에서 고졸 비중이 가장 높았다.
전문인력의 대졸 이상 비중은 53.7%로, 전년 대비 5.7%p 하락했다.
국적별로 보면, 외국인의 국적 비중은 한국계중국(29.9%), 베트남(16.0%) 순이고, 아시아(91.4%)의 비중이 높았다.
비전문취업(87.2%), 전문인력(53.7%), 결혼이민(35.2%)은 기타아시아 비중이 가장 높았다.
방문취업(87.4%), 재외동포(74.4%), 영주(69.7%)는 한국계중국 비중이 가장 높고, 유학생은 베트남(42.3%) 비중이 가장 높았다.
거주지역을 보면, 외국인의 57.5%가 수도권에 거주하며, 방문취업(81.0%), 영주(77.5%), 재외동포(76.7%)의 수도권 거주 비중이 높았다.
비전문취업은 경기(37.4%), 동남권(17.1%), 충청권(16.7%) 순으로 거주 비중이 높고, 서울(0.5%)이 가장 낮았다.
유학생은 서울(28.1%) 거주 비중이 가장 높고, 그 외 체류자격은 경기 거주 비중이 가장 높았다.
전년 대비 모든 체류자격에서 서울 거주 비중은 하락했다.
외국인의 가정 생할에서 거처 종류 및 점유 형태을 보면, 외국인 거처 종류 비중은 일반주택(58.5%), 아파트(20.0%), 기숙사(13.2%) 순이다.
방문취업(81.8%), 유학생(75.3%), 재외동포(70.2%)는 일반주택 비중이 높고, 비전문취업은 기숙사(47.7%) 비중이 높았다.
외국인 점유 형태 비중은 전·월세(59.3%), 무상(26.6%), 자기 집(14.1%) 순이다.
전·월세 비중은 유학생(91.9%), 방문취업(82.3%), 재외동포(70.8%) 등에서 높고, 무상은 비전문취업(76.7%)이 높았다.
함께 사는 사람을 보면, 외국인이 함께 사는 사람은 ‘가족·친인척 등’(48.6%) 비중이 가장 높고, ‘혼자 살고 있음’(28.1%), ‘직장 동료 등 기타 동거인’(23.2%) 순이다.
비전문취업은 ‘직장 동료 등 기타 동거인’과 함께 사는 비중(67.1%)이 높고, ‘가족·친인척 등’과 함께 사는 비중(2.0%)은 전체 체류자격 중 가장 낮았다.
평균 가구원 수는 결혼이민(3.2명)이 가장 많고, 비전문취업·영주(2.7명), 재외동포(2.5명) 순이다.
외국인의 고용 현황에서 경제활동상태를 보면, 경제활동인구는 체류자격별 경제활동인구 비중은 비전문취업(100.0%), 전문인력(99.8%), 방문취업(80.8%), 영주(80.0%)가 높았다.
전체 외국인 경제활동인구 중에서 비전문취업(27.1%) 비중이 가장 높고, 재외동포(23.0%), 영주(11.0%) 순이다.
취업자는 체류자격별 취업자 비중은 비전문취업(99.9%), 전문인력(99.4%), 영주(75.7%), 방문취업(74.1%)이 높았다.
전체 외국인 취업자 중 비전문취업(28.9%) 비중이 가장 높고, 재외동포(22.8%), 영주(11.1%) 순이다.
비경제활동인구는 체류자격별 비경제활동인구 비중은 유학생(71.1%)이 가장 높고, 결혼이민(35.1%), 재외동포(33.4%) 순이다.
전체 외국인 비경제활동인구 중 유학생(33.1%) 비중이 가장 높았다.
산업별 및 직업별 취업자에서 산업을 보면, 외국인 취업자의 산업별 비중은 광·제조업(44.9%), 도소매·숙박·음식점업(20.4%), 사업·개인·공공서비스업 등(13.4%), 건설업(9.6%) 순이다.
비전문취업(79.7%), 전문인력(57.4%), 결혼이민(35.6%) 등은 광·제조업 비중이 가장 높았다.
유학생(83.4%), 방문취업(36.6%)은 도소매·숙박·음식점업 비중이 가장 높았다.
직업은 외국인 취업자의 직업별 비중은 단순노무 종사자(27.1%), 장치·기계조작 및 조립 종사자(25.6%), 기능원 및 관련 기능 종사자(16.7%) 순이다.
유학생(42.7%), 방문취업(34.9%), 결혼이민(32.5%), 재외동포(26.6%)는 단순노무 종사자 비중이 가장 높았다.
비전문취업은 장치·기계 조작 및 조립 종사자(48.0%), 전문인력은 관리자·전문가 및 관련 종사자(31.1%), 영주는 기능원 및 관련 기능 종사자(24.8%) 비중이 가장 높았다.
취업시간을 보면, 외국인 취업자의 취업시간은 ‘40~50시간 미만’ 비중(58.1%)이 가장 높고, ‘50~60시간 미만’(17.8%), ‘60시간 이상’(8.7%) 순이다.
비전문취업(67.0%), 전문인력(63.6%), 영주(60.1%) 등은 ‘40~50시간 미만’ 비중이 가장 높았다.
평균 취업시간은 비전문취업이 45.9시간으로 가장 높으며, 유학생은 23.3시간으로 가장 낮았다.
임금근로자의 임금수준을 보면, 외국인 임금근로자의 월평균 임금수준별 비중은 ‘200~300만 원 미만’이 50.2%, ‘300만 원 이상’이 36.9% 이다.
비전문취업(68.9%), 결혼이민(48.9%), 방문취업(42.8%)은 ‘200~300만 원 미만’ 비중이 가장 높았다.
영주(59.3%), 전문인력(50.8%), 재외동포(46.3%)는 ‘300만 원 이상’ 비중이 가장 높고, 유학생은 ‘100~200만 원 미만’(51.2%)이 가장 높았다.
임금근로자의 직장 만족도을 보면, 외국인 임금근로자의 직장 만족도 중 ‘만족’ 비중은 전반적인 만족도 68.7%, 작업장 청결 및 안전 정도 68.2%, 근로시간 62.4%, 임금 및 보수 60.5%이다.
전반적인 만족도는 전반적인 만족도에 대한 ‘만족’ 비중은 비전문취업이 77.0%로 가장 높고, 방문취업(58.7%), 유학생(61.2%)은 상대적으로 낮았다.
임금 및 보수는 임금 및 보수에 대한 ‘만족’ 비중은 비전문취업이 74.2%로 가장 높고, 유학생(49.2%), 재외동포(50.2%)는 상대적으로 낮았다.
근로시간은 근로시간에 대한 ‘만족’ 비중은 비전문취업이 71.9%로 가장 높고, 방문취업(50.7%), 재외동포(53.5%)는 상대적으로 낮았다.
작업장 청결 및 안전 정도는 작업장 청결 및 안전 정도에 대한 ‘만족’ 비중은 전문인력이 77.1%로 가장 높고, 방문취업(57.6%), 재외동포(61.6%)는 상대적으로 낮았다.
임금근로자의 이직 희망 및 사유를 보면, 다른 직장으로 이직을 희망하는 외국인 임금근로자는 10.8%이며, 이직 희망 비중은 결혼이민(15.2%), 유학생(14.1%), 방문취업(13.2%) 순이다.
이직 희망 사유 비중은 ‘임금이 낮아서’(38.4%), ‘일이 힘들거나 위험해서’(22.0%) 순이다.
‘임금이 낮아서’의 비중은 전문인력(47.8%), 재외동포(38.2%) 등 모든 체류자격에서 가장 높았다.
‘일이 힘들거나 위험해서’의 비중은 결혼이민(28.3%), 영주(25.8%), 재외동포(25.4%) 순이다.
‘직장에 특별한 불만은 없지만 더 좋은 일자리를 원해서’의 비중은 유학생(24.7%), 전문인력(19.6%), 방문취업(18.3%) 순이다.
실업자의 구직경로(복수응답)는 체류자격별 외국인 실업자의 주된 구직경로 중 ‘친척·친구·동료’의 비중은 비전문취업(100.0%), 방문취업(70.0%)에서 높고, ‘대중매체’ 비중은 유학생(54.7%), 전문인력(50.0%)에서 높았다.
비경제활동인구의 주된 활동상태는체류자격별 외국인 비경제활동인구의 주된 활동상태 중 결혼이민은 ‘육아 및 가사’(81.7%) 비중이 높고, 유학생은 ‘정규교육기관 통학’(72.8%) 비중이 높았다.
외국인의 경제 생활에서 월평균 총소득을 보면, 외국인의 월평균 총소득 구간별 비중은 ‘200~300만 원 미만’(32.4%), 없음(30.0%), ‘300만 원 이상’(26.0%) 순이다.
비전문취업(68.0%) 등은 ‘200~300만 원 미만’ 비중이 높고, 없음은 유학생(66.3%)이 높았다.
전문인력(50.9%)과 영주(48.0%)는 ‘300만 원 이상’ 비중이 높았다.
총소득 대비 지출을 보면, 외국인의 총소득 대비 지출부문별 비중은 ‘생활비’(37.3%), ‘국내외 송금’ (25.5%), ‘저축’(15.4%), ‘주거비’(11.9%) 순이다.
‘생활비’ 비중은 비전문취업과 전문인력을 제외한 체류자격에서 가장 높았다.
비전문취업(56.5%)과 전문인력(36.1%)은 ‘국내외 송금’ 비중이 가장 높았다.
지난 1년간 경제적 어려움 경험 및 유형(복수응답)을 보면, 지난 1년간 경제적 어려움을 경험한 외국인 비중은 12.9%이고, 유학생(22.0%), 방문취업(15.8%), 재외동포(14.2%) 순이다.
외국인의 경제적 어려움 유형 비중은 ‘병원비가 부담되어 진료를 받지 못함’(36.2%), ‘공과금을 기한 내에 납부하지 못한 적이 있음’(29.4%), ‘본인 또는 가족의 학비 마련이 어려웠음’(25.0%) 순이다.
‘병원비가 부담되어 진료를 받지 못함’ 비중은 재외동포(46.9%), 방문취업(38.3%)이 높았다.
‘공과금을 기한 내에 납부하지 못한 적이 있음’ 비중은 유학생(36.4%), 결혼이민(34.2%)이 높았다.
외국인의 언어 생활에서 한국어능력시험 응시 경험 및 급수를 보면, 한국어능력시험에 응시하여 급수를 취득한 외국인 비중은 21.0%이다.
체류자격별 한국어능력시험 급수 취득 비중은 유학생(55.0%), 전문인력(34.6%)이 높고, 방문취업(4.0%), 재외동포(7.3%)는 낮았다.
한국어능력시험 취득 급수 비중은 2급(21.8%), 4급(19.4%), 3급(17.7%) 순이다.
6급 취득 비중은 영주(34.5%), 재외동포(28.4%)가 높고, 1급은 비전문취업(33.6%)이 가장 높았다.
한국어 실력을 보면, 외국인의 한국어 실력은 모든 부문에서 ‘잘함’* 비중이 높으며, 부문별로는 듣기(49.3%), 말하기(46.7%), 읽기(45.0%), 쓰기(40.0%) 순이다.
말하기에서 말하기 실력에 대한 ‘잘함’ 비중은 영주(82.5%), 재외동포(75.9%)가 높고, 비전문취업(21.5%), 유학생(30.1%)은 상대적으로 낮았다.
듣기에서 듣기 실력에 대한 ‘잘함’ 비중은 영주(82.7%), 재외동포(77.0%)가 높고, 비전문취업(25.4%), 전문인력(34.0%)은 상대적으로 낮았다.
읽기에서 읽기 실력에 대한 ‘잘함’ 비중은 영주(77.5%), 재외동포(71.8%)가 높고, 비전문취업(20.8%), 전문인력(30.7%)은 상대적으로 낮았다.
쓰기에서 쓰기 실력에 대한 ‘잘함’ 비중은 영주(73.1%), 재외동포(69.4%)가 높고, 비전문취업(16.0%), 전문인력(22.2%)은 상대적으로 낮았다.
*아래는 위 기사를 ‘구글 번역’으로 번역한 영문 기사의 [전문]입니다.‘구글번역’은 이해도 높이기를 노력하고 있습니다. 영문 번역에 오류가 있을 수 있음을 전제로 합니다.<*Below is the full text of the English translation of the above article using Google Translate. Google Translate strives to improve comprehension. Please understand that there may be errors in the English translation.>
2025 Immigrant Status and Employment Survey: Foreigners' Life in Korea by Residence Status
-Break News Incheon Park Sang-do Reporter
On the 10th, the government released the "2025 Immigrant Status and Employment Survey: Foreigners' Life in Korea by Residence Status."
The data shows that as of May 2025, there were 1.692 million resident foreigners aged 15 and older (hereinafter referred to as "foreigners").
Compared to the previous year, there was an increase in the number of international students (36,000) and permanent residents (21,000), while the number of visiting workers (-10,000) decreased.
The proportions by residency status are as follows: overseas Koreans (24.2%), non-professional workers (19.0%), international students (14.0%), and permanent residents (9.6%).
Compared to the previous year, there was an increase in the international students (1.2 percentage points) and professional workers (0.7 percentage points).
By gender, the proportion of foreigners was 15.8 percentage points higher for men (57.9%) than for women (42.1%).
Men were more likely to be non-professional workers (90.4%), professionals (76.4%), and visiting workers (57.0%), while women were more likely to be marriage immigrants (79.5%) and international students (52.1%).
Compared to the previous year, the proportions of men increased in the professional workers (4.6 percentage points) and permanent residents (2.0 percentage points), while the proportions of women increased in the overseas Koreans (1.0 percentage points).
By age group, the proportion of foreigners is 30.9% for those aged 15-29, 27.5% for those in their 30s, and 15.7% for those in their 40s.
93.0% of non-professional workers are in their 30s or younger (46.9% for those aged 15-29 and 46.1% for those in their 30s). The highest proportion of visiting workers is among those in their 50s (43.0%), and among professional workers, those in their 30s (53.5%).
Compared to the previous year, visiting workers increased by 5.8 percentage points among those in their 30s and decreased by 7.4 percentage points among those in their 50s.
90.5% of international students are aged 15-29, and 39.6% of overseas Koreans are aged 60 or older.
By education level, the proportion of foreigners with a high school diploma is 43.1%, followed by college or higher (30.8%).
Excluding professional workers and other categories, high school graduates accounted for the highest proportion of residence statuses.
The proportion of professional workers with a college degree or higher was 53.7%, a 5.7 percentage point decrease from the previous year.
By nationality, Korean-Chinese nationalities accounted for the largest proportion of foreigners (29.9%), followed by Vietnamese (16.0%), with Asians accounting for the largest proportion (91.4%).
Non-professional workers (87.2%), professionals (53.7%), and marriage immigrants (35.2%) accounted for the highest proportion of Other Asians.
Korean-Chinese nationalities accounted for the largest proportion of visiting workers (87.4%), overseas Koreans (74.4%), and permanent residents (69.7%), while Vietnamese nationalities accounted for the largest proportion of international students (42.3%).
Looking at residential areas, 57.5% of foreigners reside in the Seoul metropolitan area, with the highest proportions of visiting workers (81.0%), permanent residents (77.5%), and overseas Koreans (76.7%).
Non-professional workers had the highest proportions of residents in Gyeonggi (37.4%), the Southeast (17.1%), and the Chungcheong region (16.7%), with Seoul (0.5%) being the lowest.
International students had the highest proportion of residents in Seoul (28.1%), while Gyeonggi was the most prevalent among all other residency statuses.
Compared to the previous year, the proportion of residents in Seoul decreased across all residency statuses.
Regarding the housing types and occupancy patterns of foreigners' households, the most common housing types for foreigners were general houses (58.5%), apartments (20.0%), and dormitories (13.2%).
Visiting job seekers (81.8%), international students (75.3%), and overseas Koreans (70.2%) had a high proportion of general housing, while non-professional workers had a high proportion of dormitories (47.7%).
The proportion of foreigners living in their own homes was 59.3% for monthly rent (jeonse/jeonse), 26.6% for free housing, and 14.1% for their own homes.
The proportion of monthly rent/jeonse was high among international students (91.9%), 82.3% for monthly rent (jeonse/jeonse), and 70.8% for overseas Koreans. Non-professional workers had a high proportion of free housing (jeonse/jeonse).
Regarding cohabitants, the highest proportion of foreigners living with "family/relatives, etc." (48.6%) was followed by "living alone" (28.1%) and "coworkers or other cohabitants" (23.2%).
Among non-professional workers, the proportion of those living with "coworkers or other cohabitants" was high (67.1%), while the proportion of those living with "family, relatives, etc." (2.0%) was the lowest among all residence statuses.
The average household size was highest among marriage immigrants (3.2 people), followed by non-professional workers/permanent residents (2.7 people), and overseas Koreans (2.5 people).
Looking at the economic activity status of foreigners, the proportion of the economically active population by residence status was highest among non-professional workers (100.0%), professionals (99.8%), visiting workers (80.8%), and permanent residents (80.0%).
Among the total foreign economically active population, non-professional workers (27.1%) accounted for the highest proportion, followed by overseas Koreans (23.0%) and permanent residents (11.0%).
Among employed persons, the highest proportions by residency status were non-professional workers (99.9%), professionals (99.4%), permanent residents (75.7%), and visiting workers (74.1%).
Non-professional workers accounted for the largest proportion of all foreign workers (28.9%), followed by overseas Koreans (22.8%) and permanent residents (11.1%).
Among the economically inactive population, international students accounted for the largest proportion (71.1%), followed by marriage immigrants (35.1%) and overseas Koreans (33.4%).
International students accounted for the largest proportion (33.1%) of the total foreign non-economically active population.
Looking at the number of employed persons by industry and occupation, the industry-specific share of foreign workers is mining and manufacturing (44.9%), followed by wholesale/retail, accommodation/restaurants (20.4%), business/personal/public services (13.4%), and construction (9.6%).
The mining and manufacturing industry had the highest share of non-professional workers (79.7%), professional workers (57.4%), and marriage immigrants (35.6%).
The wholesale/retail, accommodation/restaurants, and restaurant industries had the highest share of international students (83.4%) and visiting workers (36.6%).
The occupational share of foreign workers is as follows: manual laborers (27.1%), equipment/machinery operators and assemblers (25.6%), and skilled workers and related skilled workers (16.7%).
International students (42.7%), visiting workers (34.9%), marriage immigrants (32.5%), and overseas Koreans (26.6%) had the highest proportion of unskilled laborers.
Non-professional workers included those engaged in equipment/machine operation and assembly (48.0%), professionals (31.1%), and permanent residents (24.8%).
Regarding working hours, the highest proportion of foreign workers worked "less than 40-50 hours" (58.1%), followed by "less than 50-60 hours" (17.8%) and "more than 60 hours" (8.7%).
Non-professional workers (67.0%), professionals (63.6%), and permanent residents (60.1%) had the highest proportion of "less than 40-50 hours."
Non-professional workers had the highest average working hours at 45.9 hours, while international students had the lowest at 23.3 hours.
Looking at the wage levels of wage earners, 50.2% of foreign workers earned between 2 million and 3 million won, while 36.9% earned over 3 million won.
Non-professional workers (68.9%), marriage immigrants (48.9%), and visiting workers (42.8%) had the highest percentage of working hours between 2 million and 3 million won.
Permanent residents (59.3%), professionals (50.8%), and overseas Koreans (46.3%) had the highest percentage of working hours above 3 million won, while international students had the highest percentage of working hours between 1 million and 2 million won (51.2%).
Looking at the job satisfaction of salaried workers, the percentage of "satisfied"* among foreign salaried workers was 68.7% for overall satisfaction, 68.2% for workplace cleanliness and safety, 62.4% for working hours, and 60.5% for wages and compensation.
Non-professional workers were the highest at 77.0%, while visiting workers (58.7%) and international students (61.2%) were relatively lower.
Non-professional workers were the highest at 74.2%, while international students (49.2%) and overseas Koreans (50.2%) were relatively lower.
Non-professional workers were the highest at 71.9%, while visiting workers (50.7%) and overseas Koreans (53.5%) were relatively lower.
Regarding workplace cleanliness and safety, professional workers were the most satisfied with the situation at 77.1%, while visiting workers (57.6%) and overseas Koreans (61.6%) were relatively less satisfied.
Regarding the reasons for job changes among foreign workers, 10.8% of foreign workers wished to move to another job. The most common reasons for job changes were marriage immigrants (15.2%), international students (14.1%), and visiting Koreans (13.2%).
The most common reasons for job changes were "low wages" (38.4%) and "difficult or dangerous work" (22.0%).
"Low wages" were the highest across all residency statuses, including professional workers (47.8%) and overseas Koreans (38.2%).
The most common response, "Because the work is difficult or dangerous," was marriage immigrants (28.3%), followed by permanent residents (25.8%) and overseas Koreans (25.4%).
The most common response, "Because I'm not particularly dissatisfied with my job, but I want a better one," was international students (24.7%), professionals (19.6%), and visiting job seekers (18.3%).
Regarding job-seeking routes (multiple responses), among unemployed foreigners by residency status, "relatives, friends, and colleagues" was the most common job-seeking route among non-professional workers (100.0%) and visiting job seekers (70.0%). "Mass media" was the most common among international students (54.7%) and professionals (50.0%).
Among the economically inactive population, the primary activity status of foreigners by residence status was "childcare and housework" (81.7%) for marriage immigrants, while "commuting to regular educational institutions" (72.8%) was the highest for international students.
Looking at the average monthly gross income of foreigners, the average monthly gross income by income bracket was "2 million to less than 3 million won" (32.4%), "none" (30.0%), and "3 million won or more" (26.0%).
Non-professional employment (68.0%) was the most prevalent in the "2 million to less than 3 million won" bracket, while international students (66.3%) were the most prevalent in the "none" bracket.
Professional workers (50.9%) and permanent residents (48.0%) had a high percentage of "3 million won or more" income.
Looking at expenditures relative to total income, the largest proportion of foreigners' total income is spent on "living expenses" (37.3%), "domestic and international remittances" (25.5%), "savings" (15.4%), and "housing" (11.9%).
"Living expenses" accounted for the highest proportion of all residency statuses, excluding non-professional employment and professional workers.
Non-professional workers (56.5%) and professionals (36.1%) reported the highest proportion of those experiencing financial hardship, including remittances domestically and internationally.
Regarding the experience and types of financial hardship (multiple responses) over the past year, 12.9% of foreigners experienced financial hardship, followed by international students (22.0%), visiting workers (15.8%), and overseas Koreans (14.2%).
The most common types of financial hardship among foreigners were "unable to receive medical treatment due to the burden of hospital bills" (36.2%), "failed to pay utility bills on time" (29.4%), and "difficulty paying tuition for myself or my family" (25.0%).
The proportion of those who "could not receive medical treatment due to the burden of medical expenses" was high among overseas Koreans (46.9%) and working overseas Koreans (38.3%).
The proportion of those who "failed to pay utility bills on time" was high among international students (36.4%) and marriage immigrants (34.2%).
When looking at the experience and level of the Korean Language Proficiency Test (TOPIK) in the language life of foreigners, 21.0% of foreigners took the TPIK and achieved a level.
The proportion of foreigners who achieved a level in the TPIK by residency status was high among international students (55.0%) and professionals (34.6%), while working overseas Koreans (4.0%) and working overseas Koreans (7.3%) achieved a level in the TPIKK.
The proportion of those who achieved a level in the TPIK was in the following order: Level 2 (21.8%), Level 4 (19.4%), and Level 3 (17.7%).
The percentage of those who achieved Level 6 was highest among permanent residents (34.5%) and overseas Koreans (28.4%), while the percentage of those who achieved Level 1 was highest among those in non-professional employment (33.6%).
Regarding Korean language proficiency, foreigners scored high in all categories, with the highest percentages being listening (49.3%), speaking (46.7%), reading (45.0%), and writing (40.0%).
In the speaking section, the percentage of those who scored high in speaking was high among permanent residents (82.5%) and overseas Koreans (75.9%), while the percentage of those in non-professional employment (21.5%) and international students (30.1%) was relatively low.
In the listening section, the percentage of those who scored high in listening was high among permanent residents (82.7%) and overseas Koreans (77.0%), while the percentage of those in non-professional employment (25.4%) and professionals (34.0%) was relatively low.
In reading, the proportion of those who scored "good" in reading skills was high among permanent residents (77.5%) and overseas Koreans (71.8%), while those in non-professional employment (20.8%) and professionals (30.7%) scored relatively low.
In writing, the proportion of those who scored "good" in writing skills was high among permanent residents (73.1%) and overseas Koreans (69.4%), while those in non-professional employment (16.0%) and professionals (22.2%) scored relatively low.
원본 기사 보기:ebreaknews.com